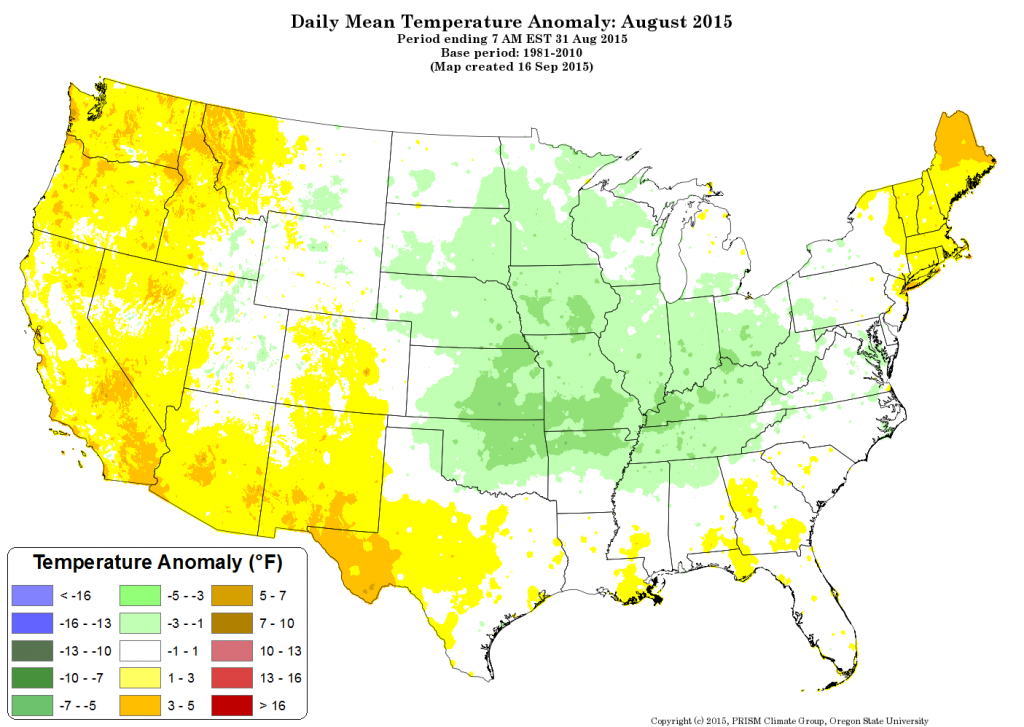
The average temperature for the contiguous United States during summer 2015 (June–August) was 72.7°F, 1.3°F above the 20th century average. Record summer heat impacted the Northwest, while the central United States remained cool. The August average temperature for the lower 48 was 73.0°F, 0.9°F above average, and the 31st warmest on record.
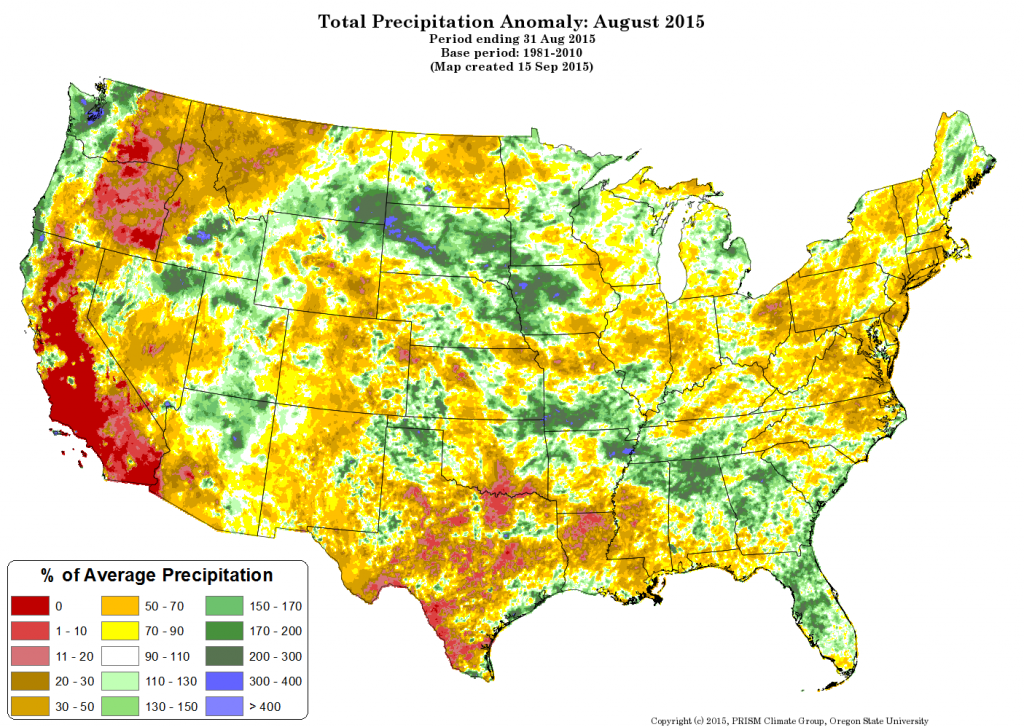
The summer precipitation total for the contiguous United States was 9.14 inches, 0.82 inch above average. Driven largely by rainfall early in the season, it was the 16th wettest summer on record. The August precipitation total for the lower 48 was 2.36 inches, 0.26 inch below average, and the 28th driest on record. Drought and wildfires plagued the West and severe drought emerged in the South.
This monthly summary from NOAA’s National Centers for Environmental Information is part of the suite of climate services NOAA provides to government, business, academia, and the public to support informed decision making.
The maps below show how the average temperature, and precipitation values for the month of May 2015 deviate from the 30-year normals (1981-2010).
-
– Click on Map to Zoom In –


