The strong El Niño that was present in the Equatorial Pacific interacted with other climate patterns to influence U.S. weather conditions during winter and February.
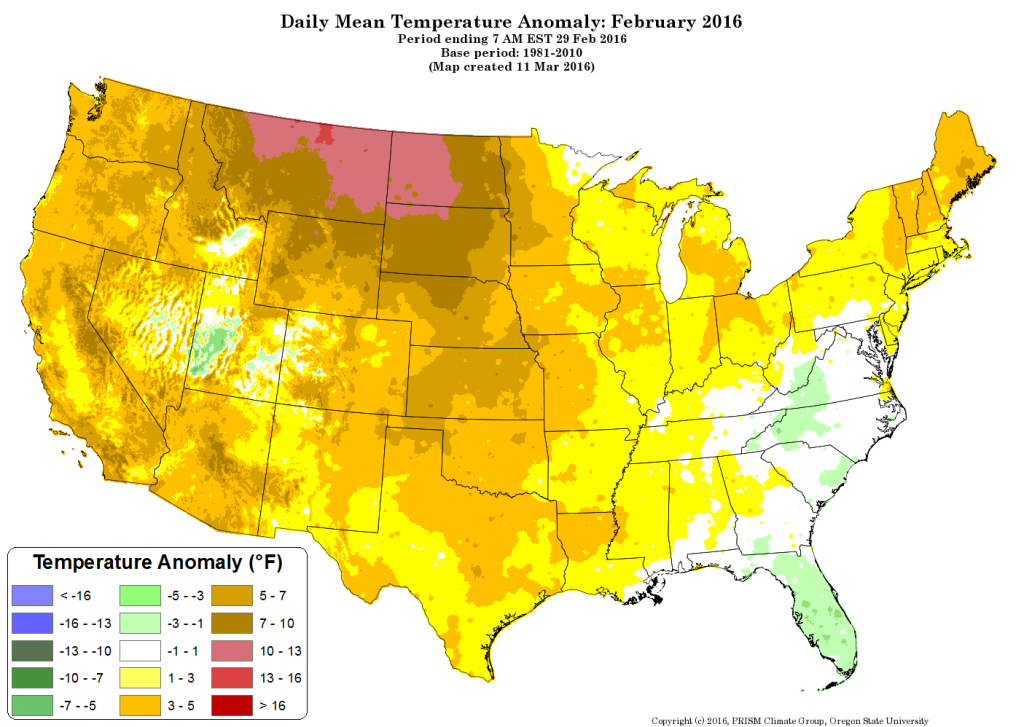
The December–February average temperature for the contiguous U.S. was 36.8°F, 4.6°F above the 20th century average, surpassing the previous record of 36.5°F set in 1999/2000. The exceptionally warm December boosted the contiguous U.S. winter temperature. The February temperature for the contiguous U.S. was 39.5°F, 5.7°F above the 20th century average, ranking as the seventh warmest on record and warmest since 2000.
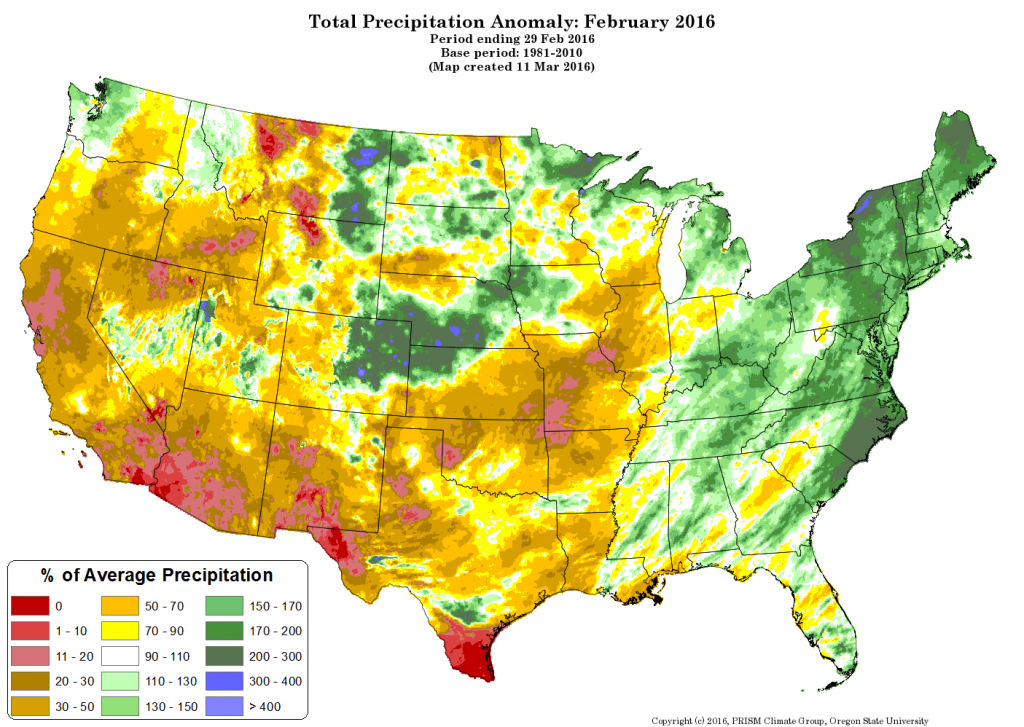
The winter precipitation total for the contiguous U.S. was 8.05 inches, 1.26 inches above the 20th century average. This was the 12th wettest December–February on record for the Lower 48 and the wettest since 1997/1998. The February precipitation total was 1.93 inches, 0.20 inch below average, and ranked near the median value in the 122-year period of record.
This monthly summary from NOAA’s National Centers for Environmental Information is part of the suite of climate services NOAA provides to government, business, academia, and the public to support informed decision making.
The maps below show how the average temperature, and precipitation values for the month of February 2016 deviate from the 30-year normals (1981-2010).
-
– Click on Map to Zoom In –


