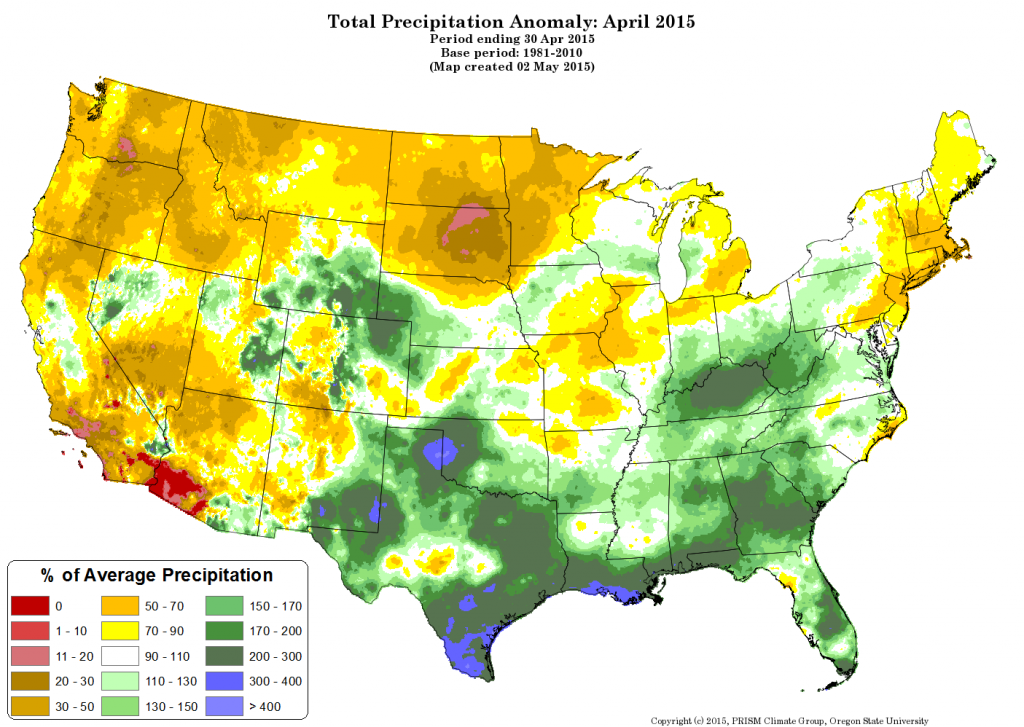
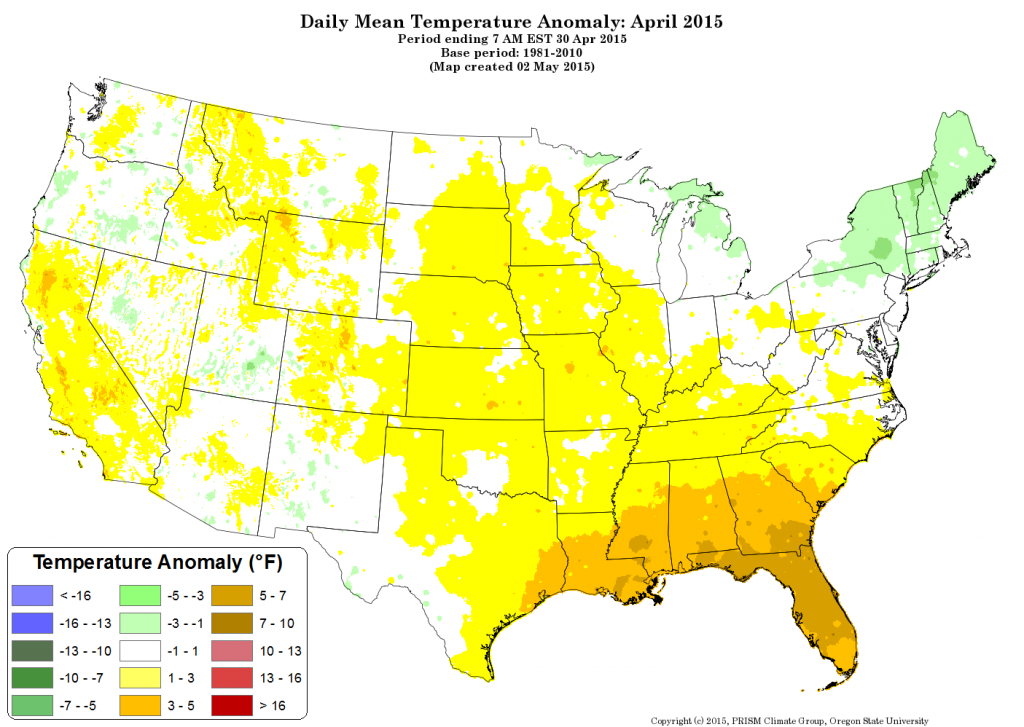
The April contiguous U.S. average temperature was 53.1°F, 2.1°F above the 20th century average—the 17th warmest April on record and warmest since 2012. Much of the contiguous U.S. was warmer than average, especially the Southeast. The April Lower 48 precipitation total was 2.78 inches, 0.26 inch above average, and ranking in the wettest one-third of the historical record.
Drought continued to intensify in the Upper Midwest and Northern Plains, while flooding rains impacted the Ohio Valley. The wet season ends in California and the Pacific Northwest by the end of April, minimizing the chance for significant drought improvement going into summer.
This monthly summary is provided by NOAA’s National Climatic Data Center in Asheville, North Carolina.
The maps below show how the average temperature, and precipitation values for the month of April 2015 deviate from the 30-year normals (1981-2010).
– Click on Map to Zoom In –


